


A BEGINNER'S GUIDE TO WEATHER SATELLITE IMAGERY
When you sail on the seven seas, you need to understand what is happening with the weather. Severe weather can be the end of your voyage and the end of your life.
Real Ocean Cruisers have lots of tools available to help them understand the weather and to predict what will happen in the short term.
We have Iridium Go on board Exit Only, and we can download the latest visible and infrared satellite images whenever we want.
But no matter how many tools we have, if we don’t know how to use them, the tools are of little use.
One of the most valuable tools is weather satellite imagery.
Interpreting what you sea on satellite photos is a use it or lose it situation. If you don’t look at the images regularly, the principles of interpreting them atrophy from disuse
After going through dozens of learning and forgetting cycles, I have finally decided to summarize what I have learned about the interpretation of weather satellite photos.
Now I have a resource that I can use to easily refresh my knowledge when I look at satellite images.
This summary is not exhaustive, but it is a place to start.
Here is what I have learned about satellite images so far.
There are three common types of satellite images used by sailors to understand and predict the weather: Visible, Infrared, and Water Vapor Images
VISIBLE SATELLITE IMAGERY
Visible satellite images are essentially photographs taken from space. These photos document the amount of light energy reflected back into space by land, sea, and clouds.
Things that reflect a large amount of light are snow, thick storm clouds, and high level clouds that have low level clouds beneath them combining to reflect more light. These show up as bright white on visible satellite images.
Thin clouds like cirrus and cirrostratus clouds without underlying lower clouds show up as a lighter gray color because of their medium level of reflected light.
Land appears as a dark gray color, and water appears almost black because of low levels of reflected light.
Visible Satellite Images have a resolution of one square kilometer per pixel.
Snow and fog are difficult to distinguish with visible imagery unless you animate the image. Clouds move in the animation whereas snow and fog don’t move.
Visible images are of no use at night because there is no light.
Visible images don’t do a good a job distinguishing between low, mid, and high level clouds because it doesn’t measure cloud temperature - it only measures reflected light.
INFRARED IMAGERY
When the sun’s energy reaches planet earth, some of the energy is reflected and some of it is absorbed. The absorbed energy is emitted back into space in the form of heat which is detected by infrared imagery.
Infrared imagery works both in the daytime and night because heat energy is always being released from the earth, sea, and clouds. This gives you the ability to visualize clouds at night.
Air temperatures decrease with altitude, and the higher the altitude the colder it gets. Cold shows up on infrared as lighter colors, and the warmer earth’s surface shows up as darker colors.
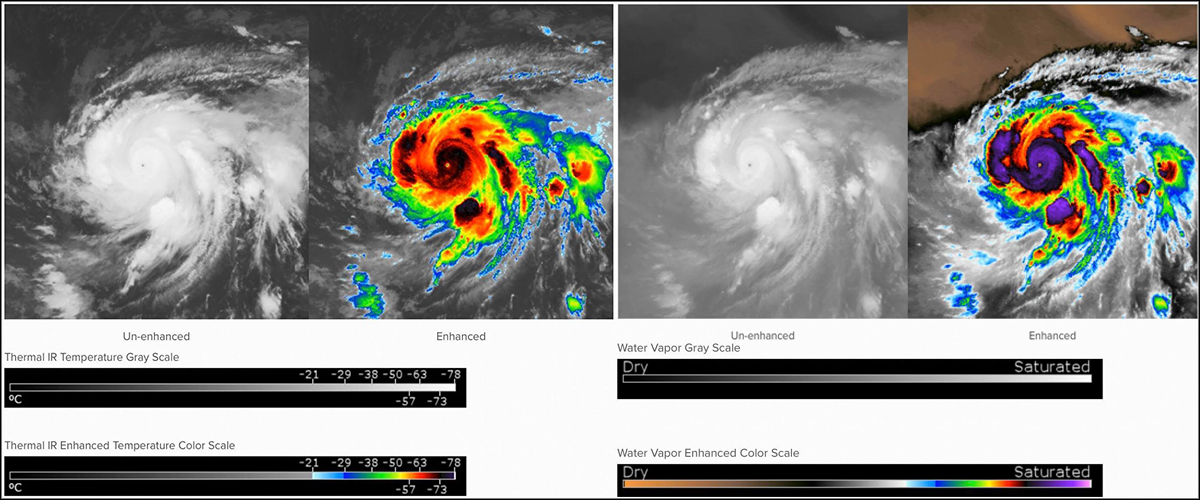
Infrared images can be either gray scale or color enhanced. The color enhancement makes it possible to separate low clouds from medium and high level clouds.
Infrared is especially useful to identify areas of extreme convection in cumulonimbus clouds which are associated with high winds and heavy rain. Infrared images make it possible to see storms at night when they cannot be visualized by visible imagery.
Infrared imagery appears different in night and day. The image has more contrast in the daytime because land is warmer in the day, and the image of land appears darker.
At night there is less contrast making it more difficult to distinguish surface land features from low level clouds in the dark. The way to tell whether you are looking at land or at low level clouds is to watch an animation in which low level clouds move and the land surface remains immobile.
Extremely cold high altitude clouds show up well on infrared images identifying clouds associated with severe weather (cumulonimbus clouds).
Infrared Imagery looks at the temperature at the tops of each layer of clouds. The higher you go in the atmosphere, the colder the cloud tops, so you can equate cloud top temperature to cloud top heights.
Colder cloud top temperatures occurs with high altitude clouds (cirrostratus, cirrocumulus, and cumulonimbus).
Warmer cloud top temperatures occur at lower altitudes (stratus, stratocumulus, and cumulus).
Infrared imagery is especially valuable because it works both in daylight and darkness. I
t is able to distinguish between low, middle and upper level clouds when color enhanced.
It is good for recognizing areas of extreme convection with cumulonimbus clouds that go up to 60,000 feet displaying very cold cloud tops.
Infrared imagery may make it possible to identify the eye of a tropical depression or hurricane when it is obscured by cloud cover.
The resolution of infrared imagery is 4 square kilometers per pixel which is less than the 1 square kilometer per pixel resolution of visible imagery.
WATER VAPOR IMAGERY
Water Vapor imagery measures the amount of the amount of water vapor contained in the mid to upper levels of the atmosphere at the 14,000 foot to 60,000 foot level.
Water Vapor Imagery allows you to follow horizontal and vertical movement of water vapor making it easier to identify troughs, ridges, and jet streams. It also helps identify upper level steering wind currents which influence the movement of storms at the surface level.
It comes in gray scale and color enhanced versions. In gray scale, darker color is dryer air, and brighter color appears in more saturated air. Cyclones and hurricanes have high moisture content in the upper atmosphere and are well visualized with color enhanced images.
Water Vapor imagery is available day and night.
Water vapor is used as a tracer to understand air movement in the upper levels of the atmosphere. It can be used to identify the eye in a tropical cyclone when it is obscured by cloud cover.
CONCISE SUMMARY
In order to get the most information from satellite imagery, you need to combine the visible and infrared images. Visible imagery helps you separate thick from thin clouds, and infrared imagery helps you distinguish between high and low clouds. Together they give you a better understanding of what is happening in the atmosphere.
You don’t need a PhD in meteorology to extract useful information from satellite imagery.
With just a few principles, you can understand enough of what is happening in your small patch of ocean to make informed decisions that keep you and your boat safe.


Awesome music video that captures the essence of what it's like to sail offshore in a catamaran around the world when conditions are less than perfect. David Abbott from Too Many Drummers sings the vocals, and he also edited the footage from our Red Sea adventures. This is the theme song from the Red Sea Chronicles.
Sailing up the Red Sea is not for the faint of heart. From the Bab al Mandeb to the Suez Canal, adventures and adversity are in abundance. If you take things too seriously, you just might get the Red Sea Blues.
If you like drum beats, and you like adventure, then have a listen to the Red Sea Chronicles Trailer.
Flying fish assault Exit Only in the middle of the night as we sail through the Arabian Gulf from the Maldives to Oman. And so begins our Red Sea adventures.
Sailing through Pirate Alley between Yemen and Somalia involves calculated risk. It may not be Russian Roulette, but it is a bit of a worry. Follow Team Maxing Out as they navigate through Pirate Alley.
Stopping in Yemen was just what the doctor ordered. We refueled, repaired our alternator, and we made friends with our gracious Yemeni hosts. We also went to Baskins Robbins as a reward for surviving Pirate Alley.
After you survive Pirate Alley, you must sail through the Gate of Sorrows (Bab Al Mandab) at the southern entrance to the Red Sea. The Gate of Sorrows lived up to its name with fifty knots of wind and a sandstorm that pummeled Exit Only for two days. Life is good.
Although I like the feel of a paper book in my hand, I love trees even more. When people purchase an eBook, they actually save trees and save money as well. Ebooks are less expensive and have no negative impact on the environment. All of Dr. Dave's books are available at Save A Tree Bookstore. Visit the bookstore today and start putting good things into your mind. It's easy to fill your mind with positive things using eBooks. No matter where you are or what you are doing, you can pull out your smart phone or tablet and start reading. You can even use electronic highlighters and make annotations in your eBooks just like paper books.